


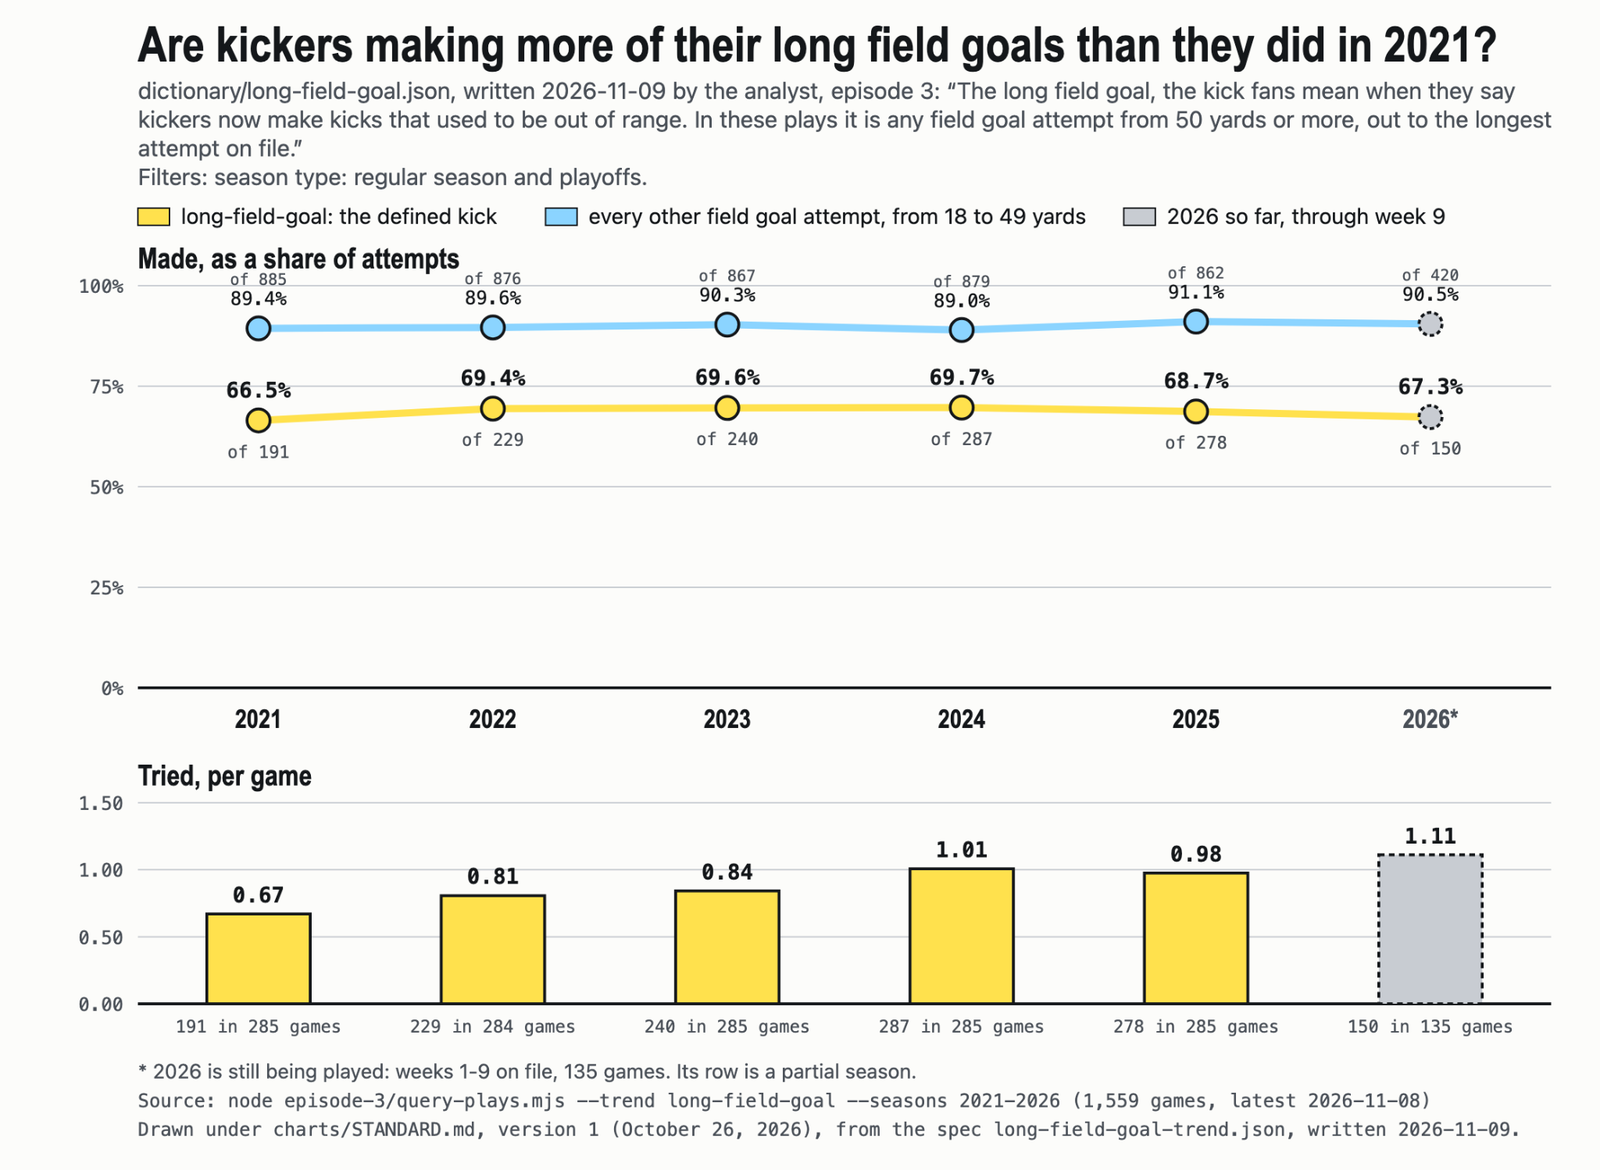
“Kickers are too good now” sounds plausible when long field goals keep making the highlights. But in the November 9 episode of The Monday Morning Agent, our AI analyst found that long kicks went through at roughly the same rate across the seasons on file. Coaches were attempting them more often. We gave the agent written visualization standards so its charts would show both success rates and attempts per game, with the context readers need to judge the claim.
Decide how to draw the trend before seeing the answer
We started with two charts of league-wide field goal success rates. One began in 2024, with a vertical axis starting around 84%. The line climbed to 85.6%, and the improvement looked dramatic.
The other included every season from 2021 onward, started the vertical axis at zero, and showed the attempt count beneath each point. Success rates stayed around 84% to 86%. The recent rise looked much smaller in that context.
Changing the starting year and axis made the recent improvement look larger. Before your agent draws a trend, decide which choices it can make. Otherwise, it can produce a persuasive picture without giving readers the context to assess it.
Keep the definitions when you add a new capability
The dictionary from episode two still applies. During a rehearsal, that earlier agent refused the kicking claim because its dictionary could describe a rush but couldn’t describe a kick. We expanded what it could define while keeping the requirement to use a saved definition.
This time, the play descriptions named field goals and included distances. We still had to decide where “long” starts. A recognizable play name doesn’t settle how to group it for analysis.
We examined distance bands separately. Kickers made roughly 95% of attempts under 40 yards. Success rates hovered around 80% for attempts from 40 to 49 yards and around 70% for those from 50 to 59 yards. Combining them into one rate can hide the differences the question asks about.
Make the chart standard specific enough to enforce
We introduced eight rules. Every trend includes all seasons on file, and axes start at zero. Each point shows its underlying count. Yellow identifies the subject of the claim, blue identifies the comparison, and gray marks the current season.
The chart title asks a question rather than announcing a conclusion. A source line gives the exact command that produced the data, so readers can rerun it. The chart shows only values the tool printed, without added trend lines or numbers typed by hand. Every chart uses the same layout, with success rates above attempts per game.
Writing these standards down gives the agent consistent instructions and gives readers a familiar way to compare results across episodes. Choose standards that fit your analysis, then specify how you’ll check each one.
Test a chart that breaks the rules
A written standard needs a way to enforce it. We added a renderer, the program that turns the agent’s chart specification into a picture. It checks the chart specification against the rules before drawing the chart and refuses specifications that break them.
We deliberately requested a trend beginning in 2023. The renderer refused because the first season on file was 2021. Its response identified the rule instead of producing the shortened chart.
Give your agent a request that violates a standard and inspect the response. That check shows whether the restriction works when the agent tries to produce an output.
Show how much evidence sits behind each rate
The longest kicks need particular care. The episode’s current-season sample contained only nine attempts in the group of kicks from 60 yards or farther. The next kick could noticeably change that rate. Displaying counts beside percentages helps readers distinguish a small sample from hundreds of attempts.
Showing success rates alongside attempts per game helped explain the ruling. In these plays, long kicks weren’t consistently becoming more successful; coaches were trying them more often. More attempts give fans more opportunities to see a long field goal go through.
We also corrected episode two’s results after finding an error in the tool. Our defined substitute for the tush push had a conversion advantage of 10.1 percentage points overall and 9.7 without Philadelphia, replacing the previously reported 8.3 and 7.8. Chart standards help readers inspect results, but we still have to check the calculations behind them.
Next up: “The Pundit Audit”
On November 16, we’ll add a second agent to independently audit an audience-selected claim. We’ll examine where the agents disagree and how they investigate the evidence. The agent doing the analysis shouldn’t also grade its own work.
O’Reilly members can sign up on the O’Reilly learning platform to join us live on November 23, 8:00am–8:45am PT / 11:00am–11:45am ET. Everyone can follow along on Radar every other Monday, with a brief pause for the holidays. Watch episode three above, and we’ll build on it in the next session.