

In 17 years of building enterprise data platforms, I’ve watched every organization eventually ask the same question: “Can I ask one question and get one answer across everything my company knows?” A finance analyst wants actual revenue from the warehouse, pipeline data from the CRM, commentary from planning documents, and market signals from external providers. The information already exists, but it lives across systems that were never designed to reason together.
For decades we tried to solve this by consolidating data. We built larger warehouses, semantic layers, APIs, and dashboards. Each solved part of the problem, but none solved the fundamental one: orchestrating reasoning across heterogeneous sources in response to an arbitrary business question. Earlier systems supported limited federation and semantic querying, yet they struggled to reason across those sources at enterprise scale without significant custom engineering.
Modern LLMs change this. Instead of replacing databases, they facilitate a new architectural primitive: an intelligent orchestration layer that dynamically reasons across specialized systems. Rather than consolidating the data into a single store, this layer consolidates the access pattern to data that stays where it lives.
This article presents a reference architecture for LLM-powered enterprise analytics agents that coordinate purpose-built, heterogeneous data stores through intelligent orchestration while preserving security, performance, and auditability.
What specifically changed with GenAI
BI tools have always been constrained to predefined reports and dashboards. Before GenAI, building a cross-system query engine meant hardcoding every possible query pattern, data source combination, and synthesis path. And because the number of possible questions grows exponentially with the number of data sources, exhaustive coverage is impossible through traditional engineering. GenAI changes this in three specific ways.
Intent understanding replaces query templates: An LLM parses natural language and determines which data sources are relevant based on semantic understanding rather than keyword matching. Unlike a keyword search, an LLM understands that “Why did retention drop in Asia last quarter?” and “What is driving churn in Asian markets?” are the same question expressed differently. More importantly, it infers that answering the question requires customer relationship data, revenue metrics, and possibly support ticket sentiment, even though none of those systems are named.
Dynamic query decomposition replaces static pipelines: A question like “What are the biggest risk factors in our supply chain?” might require relationship data from a graph database, metrics from a key-value store, contract details from a document repository, and market intelligence from an API. The agent decomposes it into specialized subqueries on the fly, each optimized for the target store’s access pattern. There’s no prebuilt pipeline and no engineering ticket to wire up a new combination, because the decomposition happens at inference time. The system handles novel questions without code changes.
Semantic synthesis replaces manual consolidation: Before GenAI, making sense of the data together was the real work. An analyst would pull numbers from the warehouse, check relationships in a CRM, read through documents, and mentally synthesize an answer. That took hours or days and was bounded by one person’s ability to hold context. I’ve watched senior analysts spend entire Mondays answering a single leadership question. An LLM reasons about how metrics relate to the relationship patterns in a knowledge graph and the strategic context in unstructured documents, and it does so in seconds with full source attribution. A dashboard shows numbers; an analytics agent explains what those numbers mean in the context of everything else it knows.
The architecture: Consolidate the access pattern, not the data
Rather than consolidating the data into a single store, consolidate the access pattern through an intelligent orchestration layer. If your instinct is to get everything into one place, you aren’t alone, but every time we did that we lost something. Graph relationships flattened into join tables, hierarchical documents shredded into rows, and real-time signals turned stale in batch loads. The warehouse was always a compromise.
The better approach is to keep each data store optimized for its specific query pattern:
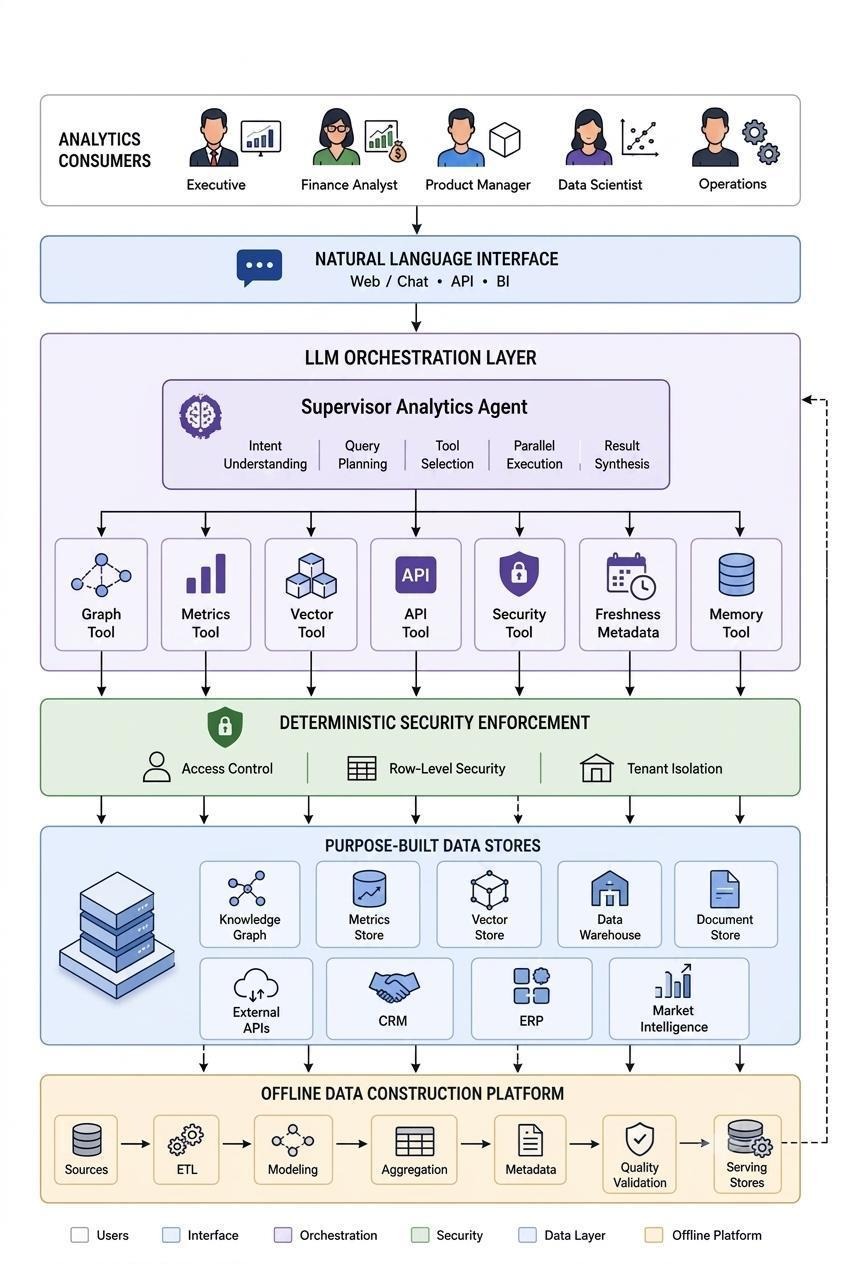
- Graph database for relationship traversal and multihop reasoning
- Key-value store for instant metric lookups with sub-millisecond latency
- Vector store for semantic document search and similarity matching
- External APIs for market intelligence and real-time signals
- Data Warehouse for large-scale historical aggregation and ad hoc SQL
The LLM-powered agent coordinates across all of them through a unified orchestration layer. This follows the same principle that makes microservices work: specialized services with well-defined interfaces, coordinated by an orchestrator. The difference is that the orchestrator now understands natural language, reasons about which services to call based on intent rather than explicit routing rules, and synthesizes results semantically rather than through programmatic joins. Think of it as a data mesh for inference, where each node keeps its operational independence while an intelligent layer federates queries across them.
The orchestration protocol
The agent follows a multiphase protocol for every query. The full reasoning loop with security enforcement and parallel execution goes well beyond a simple RAG pattern.
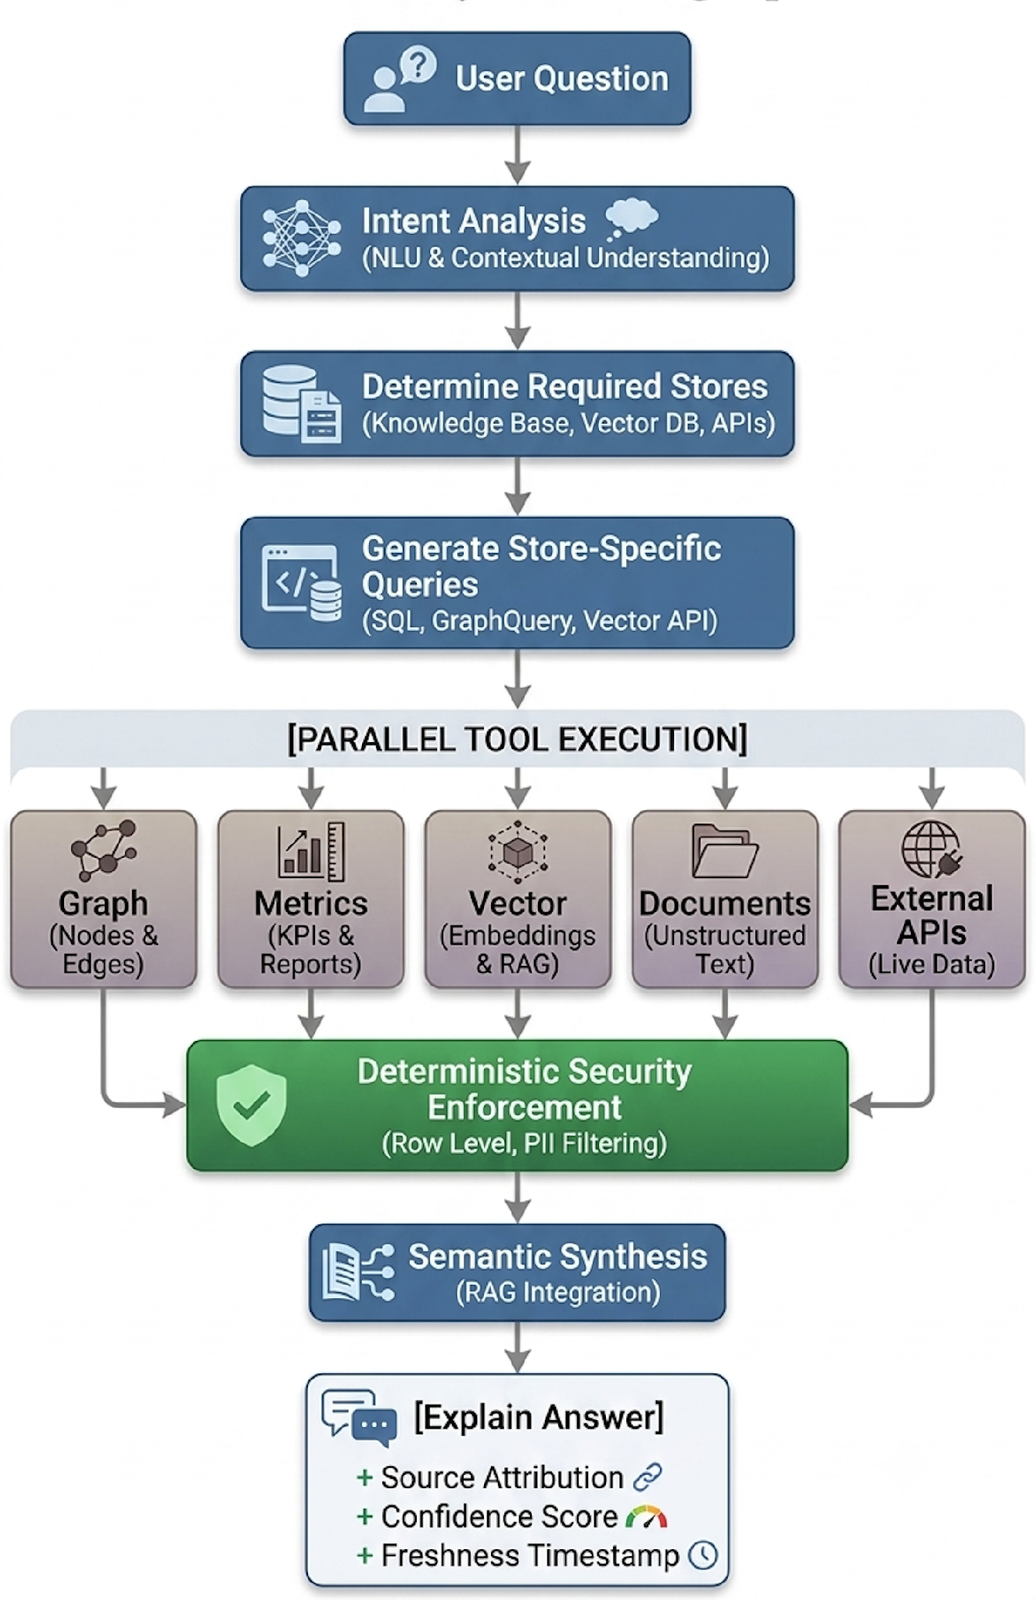
Let’s trace a business question through each phase:
“Why did Q2 revenue fall short of forecast in the enterprise segment?”
This question requires revenue metrics (metrics store), account relationships and sales coverage (graph), deal commentary and executive notes (vector store), and market benchmarks (external APIs). No single system holds the answer.
Phase 1: Intent analysis. The LLM determines what the user is asking and which data sources are relevant.
“Why did Q2 revenue fall short of forecast in the enterprise segment?”
↓
Intent: Revenue variance root cause analysis
Entities: Enterprise segment
Timeframe: Q2
Metric: Revenue vs. forecast
Required stores: Metrics + Graph + Vector + External API
Not every query needs every store. “What is our current ARR?” might need to hit the metrics store only. This revenue variance question requires all four.
Phase 2: Query decomposition. The original question is broken into specialized subqueries optimized for each target store:
- Metrics store: “Q2 revenue actuals vs. forecast for enterprise, by region and product line”
- Graph store: “Enterprise accounts with closed-lost or slipped deals in Q2; common patterns in sales coverage, partner relationships, deal stage progression”
- Vector store: “Deal notes, QBR summaries, and executive correspondence referencing enterprise deal delays or losses in Q2”
- External API: “Industry benchmark data for enterprise software spending in Q2”
Each is tailored to the target system’s access pattern, not forced through a common query language.
Phase 3: Parallel execution. Tools execute concurrently. This is critical for latency. Sequential execution across four stores would blow past any reasonable response time. With parallel execution, the total data retrieval time equals the slowest individual store, not the sum of all stores.
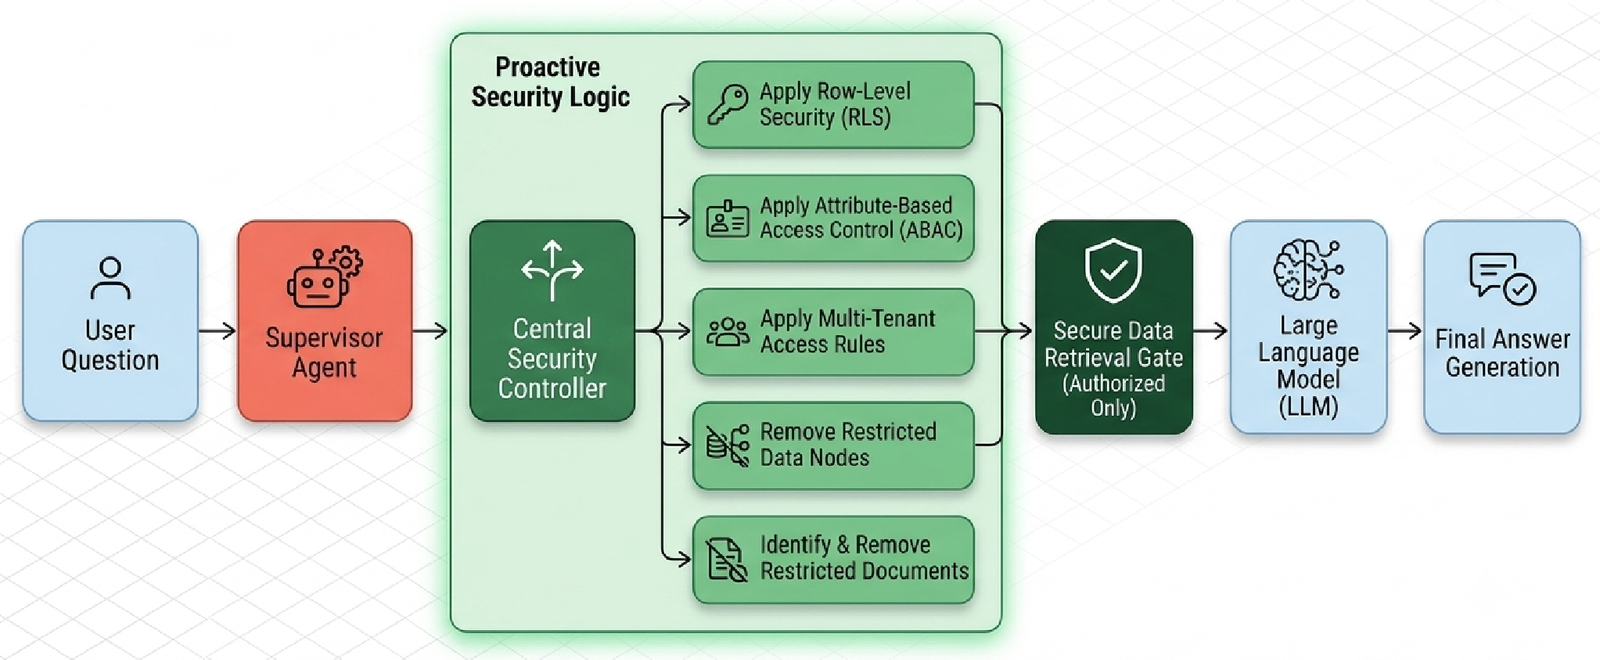
Phase 4: Deterministic security enforcement. A security layer enforces user permissions at the data query level before any retrieval happens. This is structural rather than application-level: It routes queries to the appropriate data partitions, applies row-level filters at the database query level, and gates the input rather than filtering the output. If our user is a regional VP without access to EMEA deal data, the graph returns no EMEA accounts, the metrics lookup excludes EMEA revenue, and the vector search filters out EMEA deal notes. The LLM can’t leak what it never received. (More on why this must be deterministic below.)
Phase 5: Result synthesis. The LLM reasons about how results from different stores relate, identifies patterns across sources, resolves contradictions, and generates a unified answer with source attribution.
For our revenue question, synthesis might produce:
Q2 enterprise revenue missed forecast by $4.2M (8% variance). Three root causes account for 85% of the gap: (1) Four deals totaling $2.8M slipped to Q3 due to extended legal review cycles—all four involved customers who adopted a new procurement platform in Q1 (graph: common vendor relationship). (2) Two large renewals downsized by $1.1M; deal notes cite budget reallocation toward AI initiatives, a pattern appearing across 6 QBR summaries (vector store). (3) Enterprise software spending contracted 3% QoQ industry-wide (external benchmark), suggesting partial macro headwind. Additionally, all four slipped deals lacked executive sponsor engagement in the final 30 days (graph: engagement signal absent).
No single store contains that answer. On a dashboard, the miss shows up as a red number. The orchestrated synthesis explains why it happened, surfaces the structural patterns behind it, and points to what needs to change.
The core orchestration pattern
The orchestration loop itself is straightforward. Here’s the core pattern:
from concurrent.futures import ThreadPoolExecutor, as_completed


def run_agent(question, tools, execute_fn, model="gpt-4o"):
    # Phase 1-2: LLM analyzes intent and decides which tools to call
    response = client.chat.completions.create(
        model=model, messages=[{"role": "user", "content": question}],
        tools=tools, tool_choice="auto"
    )
    tool_calls = response.choices[0].message.tool_calls


    # Phase 3: Execute tool calls in parallel
    with ThreadPoolExecutor(max_workers=len(tool_calls)) as executor:
        futures = {
            executor.submit(execute_fn, tc.function.name,
                            json.loads(tc.function.arguments)): tc
            for tc in tool_calls
        }
        results = {futures[f].id: f.result() for f in as_completed(futures)}


    # Phase 5: Synthesize results into unified answer
    messages = [response.choices[0].message]
    for tc_id, result in results.items():
        messages.append({"role": "tool", "tool_call_id": tc_id,
                         "content": json.dumps(result)})
    return client.chat.completions.create(model=model, messages=messages)
The tool definitions tell the LLM what each store is optimized for. The LLM decides which to invoke based on the question’s intent. With parallel execution, data retrieval completes in milliseconds even when hitting multiple stores simultaneously, making LLM inference the dominant latency factor, not the data layer.
Why the knowledge graph is the highest-leverage component
Knowledge graphs have existed for decades and have always been powerful. They’ve also stayed on the exotic end of the enterprise stack, and the reason is human rather than technical. The last-mile problem was translating between natural language and graph traversals. A graph database can answer extraordinarily complex relationship questions, such as “Which accounts have overlapping stakeholders with our churned customers from last quarter who also evaluated competitor products?” but asking that question required an engineer fluent in both the graph schema and the business domain. That combination of skills is rare and expensive, which is exactly why graph databases have never quite gone mainstream.
GenAI removes this bottleneck, and it does so precisely where the barrier was highest: the translation step that used to require a specialist. With an LLM as the translation layer, the graph becomes accessible to anyone who can type a question in plain language. The LLM generates graph queries, traverses multihop relationship paths, and explains results in business context. In our revenue variance example, the graph reveals that all four slipped deals share a common pattern of customers who adopted a new procurement platform in Q1 and lacked executive sponsor engagement in the final 30 days. That pattern is invisible in revenue metrics alone, because it requires relationship traversal across account nodes, vendor relationships, and engagement signals.
Designing the graph schema
The critical design decision is aligning the graph schema with your business ontology. The temptation is to model the graph around your data model (tables, columns, foreign keys). The correct approach is to model it around how your organization actually thinks about its domain:
- Entity nodes with lifecycle stages, engagement indicators, and health scores
- Product nodes connected to use cases, adoption patterns, and competitive alternatives
- Relationship edges that capture not just connections but context: strength, recency, business driver, and directionality
When the data model matches the business mental model, the agent’s responses feel natural rather than technically correct but practically useless.
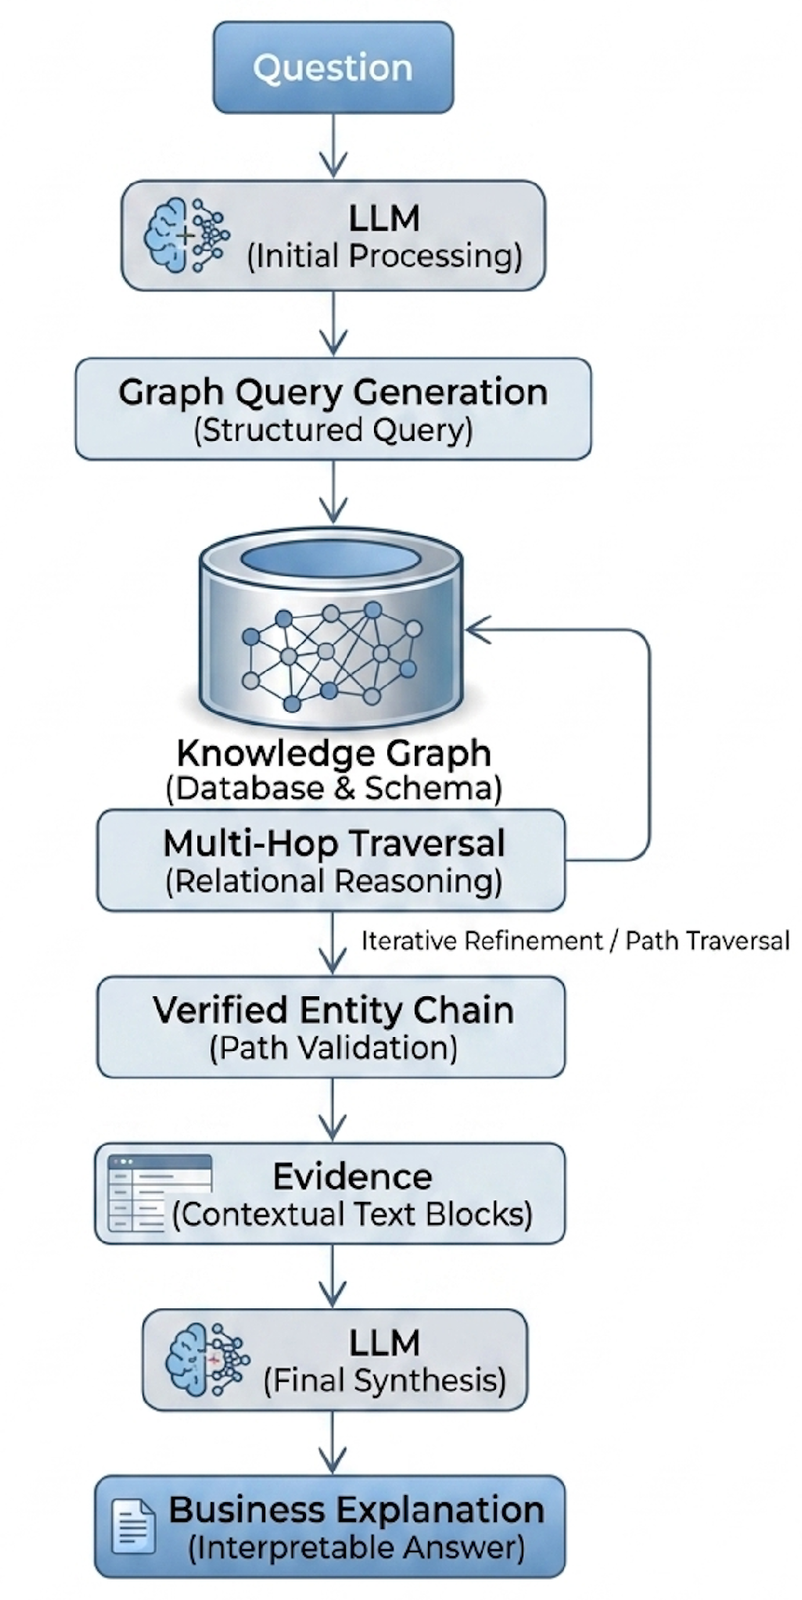
GraphRAG: Deterministic reasoning chains
A powerful extension is GraphRAG (graph retrieval-augmented generation), where the agent constructs deterministic inference paths by traversing the graph rather than relying on the LLM’s parametric knowledge. The LLM isn’t remembering something from training; it’s following an explicit path through verified data. The result is auditable reasoning chains: “Account A connects to Partner B through implementation relationship X, and Partner B appears in three other churned accounts, suggesting a systemic delivery issue.” Each step is verifiable against source data, which is critical in enterprise environments where decisions need justification beyond model confidence scores.
GraphRAG also reduces hallucination risk. When the LLM follows graph edges rather than generating from parametric memory, the actual data constrains the space of possible outputs. The graph acts as a factual guardrail on the reasoning process.
Production considerations
Moving from prototype to production exposes a set of challenges that don’t appear in demos.
Model flexibility and cost management
Decouple the orchestration layer from any specific LLM provider. I can’t stress this enough. If it’s tightly coupled to one provider’s API, you’ll end up rewriting it within a few months, when pricing changes or a better model drops. Implement model fallback for throttling resilience. The landscape moves fast, and you don’t want architectural lock-in baked into your data infrastructure.
Multihop model selection is also worth considering. Use a smaller, faster model for intent classification and query decomposition, where the task is well-defined, and a larger model for synthesis, where reasoning quality matters. Intent classification with a small model takes around 200 ms and costs a fraction of a full reasoning pass, so reserve the expensive inference for synthesis, where quality directly impacts user experience.
Security at the data layer
Row-level security must be enforced deterministically before data reaches the agent, as described in Phase 4 above. This is a nonnegotiable architectural constraint. LLMs are probabilistic systems, and security enforcement can’t be. Don’t rely on the model to filter sensitive information after the fact; the data should never enter the context window in the first place.
Data freshness and serving architecture
Separate data construction from data serving. An offline batch pipeline refreshes the stores from source systems on a scheduled cadence, and the real-time agent only reads preprocessed data. This keeps query latency low while letting computationally intensive transformations such as graph construction, embedding generation, and metric aggregation happen asynchronously. The pipeline should be idempotent and observable, with freshness monitoring per store. When the graph is six hours stale but the metrics store is real-time, the agent should know this and communicate its confidence accordingly. Add freshness metadata to every tool response rather than waiting for a user to catch a stale number and lose trust for weeks; that metadata becomes part of the agent’s context for answer generation.
Evaluation and observability
Agent responses need evaluation at both the tool level (“Did the graph query return the right entities?”) and the synthesis level (“Did the final answer correctly combine tool outputs?”). These are different failure modes that require different approaches.
Log every tool call and result, every query decomposition decision, and every synthesis step. You’ll need these traces when something goes wrong, and in a multistore system that can mean a bad graph query, a stale metric, a poorly matched document, or a synthesis error. Without traces, debugging is guesswork. Build automated evaluation pipelines that test known questions against expected answers and track accuracy over time. Degradation usually signals a data quality issue in one of the stores rather than an LLM regression.
Design that observability around the failure modes that actually occur, because production deployments rarely fail because the LLM is inaccurate. They fail because supporting systems drift. Typical examples include:
- Stale graph data causing the agent to reference relationships that no longer exist
- Poorly generated embeddings returning irrelevant documents from the vector store
- Inconsistent business definitions across stores (e.g., “active customer” means different things in the graph and the metrics store)
- Conflicting metrics from different source systems with no reconciliation logic
- Missing source attribution making answers unverifiable
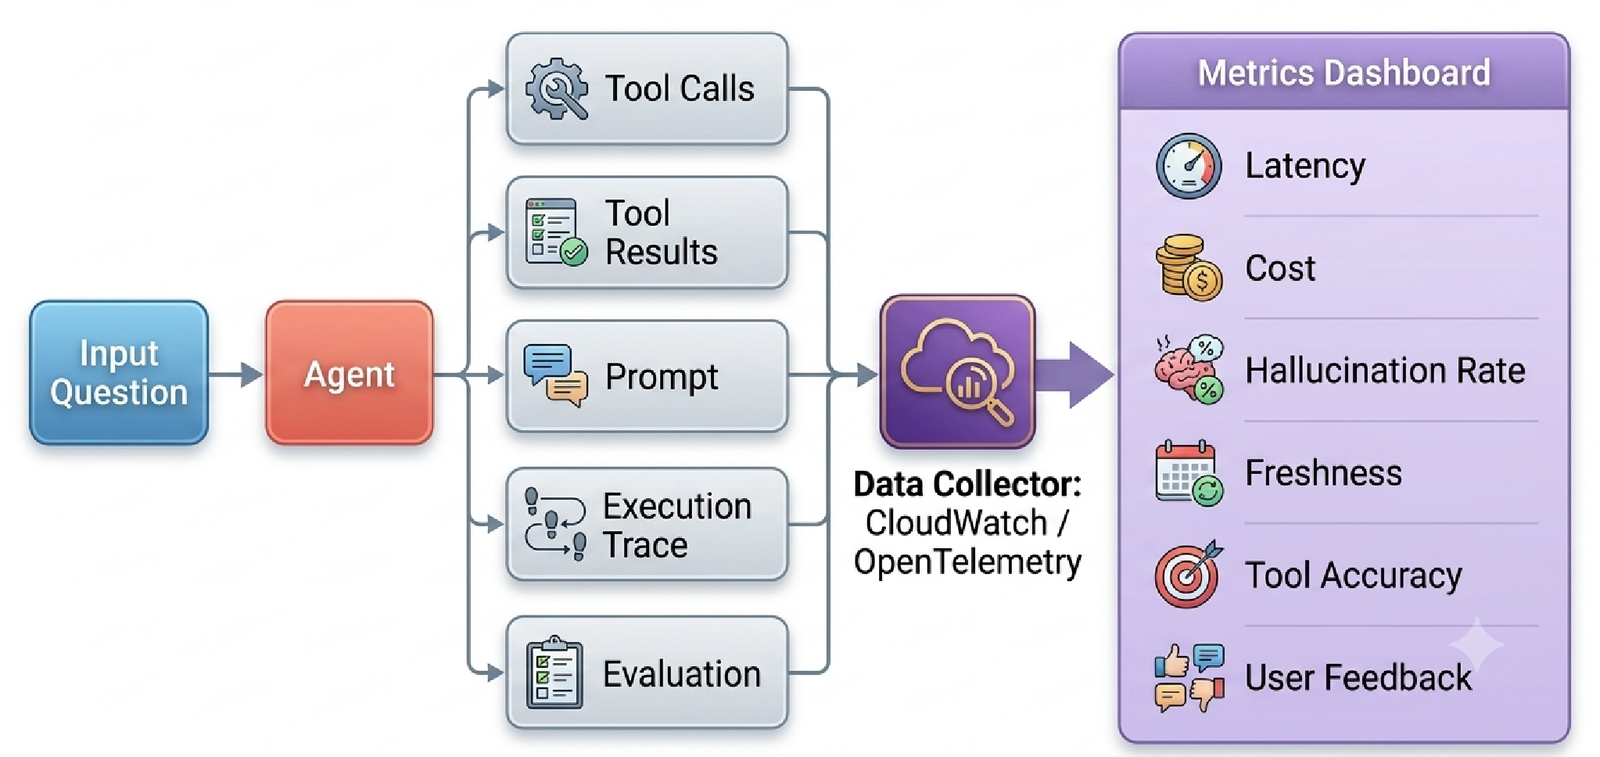
Handling these well matters just as much as prompt engineering. Most debugging sessions trace back to data quality, not model quality.
Implementation guidance
Start with the questions your BI tool can’t answer today (and beyond). The trap with a question inventory is that it captures only what people already know how to ask. The most valuable questions are usually the ones missing from every existing report. They require stitching together three systems, so users either answer them by hand in a spreadsheet or quietly give up. So catalog what your users actually care about, and pay special attention to the questions they route around. Interview analysts about the analysis they abandon halfway, the recurring spreadsheet they dread, and the follow-up question they never bother to ask because the current system makes it too expensive. If most of what you find can still be answered from a single store, you need a better dashboard, not an agent. The pattern earns its complexity only when synthesis across sources is the bottleneck rather than the data access itself.
Pick one use case and go deep. Build for the case where the manual synthesis burden is highest, where an analyst currently spends four hours pulling data from three systems to answer a leadership question. Prove value in that narrow corridor, then expand; adding a new store is incremental once the orchestration layer exists.
Invest in the knowledge graph early. It’s the hardest component to build and the highest-leverage one to have. The schema will be wrong on the first attempt and less wrong on the third. It evolves with your understanding of the domain, and that understanding deepens only through iteration with real users asking real questions.
Design for the analyst, not the engineer. The success metric isn’t technical elegance. It’s whether the finance analyst stops building the same three-system Excel mashup every Monday morning. Talk to your users, watch them work, and build for their actual workflow rather than your ideal architecture.
Measure what matters. Track response accuracy, latency (P50 and P99), user adoption, and reduction in manual synthesis time. Track the questions the agent can’t answer, because those gaps are your roadmap for which stores to add or which schemas to extend.
What this enables at scale
This pattern does more than make existing workflows faster. It enables workflows that weren’t possible before, no matter how many analysts or engineers you threw at the problem. An agent querying a graph, a metrics store, and a document repository at once can surface patterns no human would find by checking each system manually. A finding like “entities in segment X who adopted product Y and had a support escalation in the last 90 days are 3x more likely to churn” requires reasoning across three data sources in a single inference; no dashboard surfaces that, and no analyst checks that specific combination unprompted. In the same motion it democratizes access, opening information that was previously reachable only by engineers who could write Cypher or SQL to anyone who can ask a question in plain language. The analyst’s role shifts from answering routine questions toward building the ontology, curating the graph, and tackling problems that require genuine human judgment.
It also delivers auditable reasoning at enterprise scale. GraphRAG provides deterministic inference paths that are verifiable against source data, so every conclusion traces back through explicit edges and nodes. This builds trust where decisions carry financial, regulatory, or strategic weight. “The AI said so” becomes “the data shows that A connects to B through X, B exhibits property Y, and historical pattern Z suggests the following.” That traceability changes the conversation from “Can we trust AI?” to a review of the work the AI actually did.
The future of enterprise analytics is unlikely to be a larger warehouse or a smarter dashboard. It is an orchestration layer capable of reasoning across specialized systems while preserving each system’s strengths. Purpose-built data stores remain exactly where they are; what changes is how we access them.
The architectural pattern described here doesn’t replace warehouses, graphs, vector stores, or APIs. It coordinates them. That distinction is subtle, but it fundamentally changes what enterprise analytics systems can deliver. The next generation of analytics platforms will do more than answer questions faster. They’ll reason across enterprise knowledge in ways that previously required experienced human analysts. The data already existed. The orchestration layer did not.
Disclaimer: The views and architectural perspectives in this article are entirely my own and do not represent my employer or any affiliated organization. References to patterns and technologies are based on publicly available information and personal experience. No proprietary or internal information was used.